V2EX = way to explore
V2EX 是一个关于分享和探索的地方
Sign Up Now
For Existing Member  Sign In
JacobNie
V2EX  ›  Java

IntelliJ IDEA 中表视图下 show chart 表示啥意思?

  •  
  •   JacobNie · Aug 13, 2024 · 3109 views
    This topic created in 624 days ago, the information mentioned may be changed or developed.

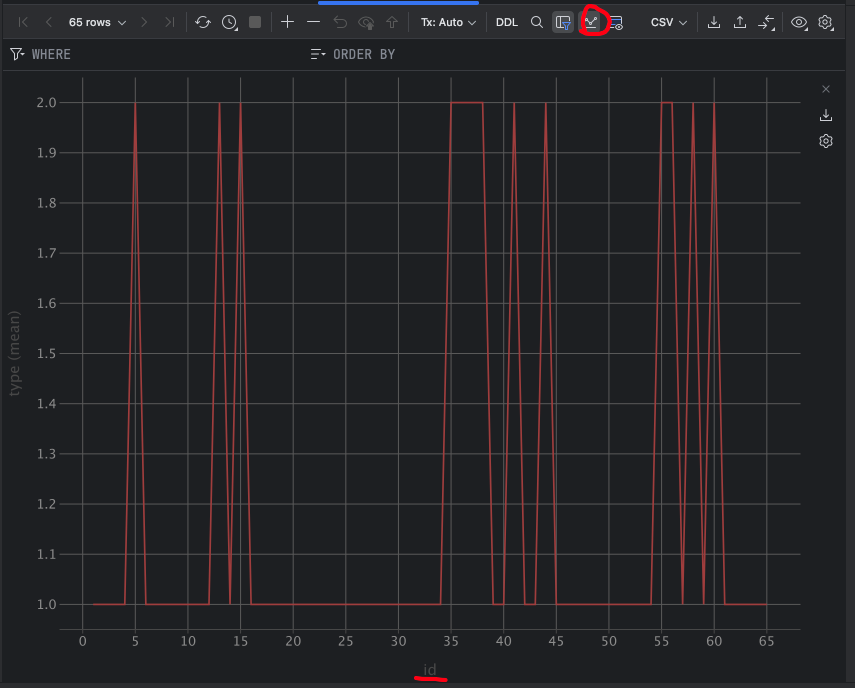
    我是 IntelliJ IDEA 小白,各位帮忙看看如图所示的数据库中的 show chart 表示啥意思

    其中的 id 是我某张表中的自增主键

    type(mean)是啥意思呢?

    ZZ7TkG

    2 replies    2024-08-13 15:44:14 +08:00
    qinxi
        1
    qinxi  
       Aug 13, 2024


    直接从表上很难看出效果, 更多的用法在于通过查询结果集查看. 至于 X 和 Y 轴可以通过小齿轮自己调整, 可以自己试试.

    其他数据库工具也有带的 https://www.metabase.com/learn/metabase-basics/querying-and-dashboards/visualization
    JacobNie
        2
    JacobNie  
    OP
       Aug 13, 2024
    谢谢你解决了我的疑问,type 也是我表中的一个字段

    ![3fGIGx]( https://img.pdoop.com/2024/0813/3fGIGx.png)
    About   ·   Help   ·   Advertise   ·   Blog   ·   API   ·   FAQ   ·   Solana   ·   963 Online   Highest 6679   ·     Select Language
    创意工作者们的社区
    World is powered by solitude
    VERSION: 3.9.8.5 · 30ms · UTC 19:54 · PVG 03:54 · LAX 12:54 · JFK 15:54
    ♥ Do have faith in what you're doing.